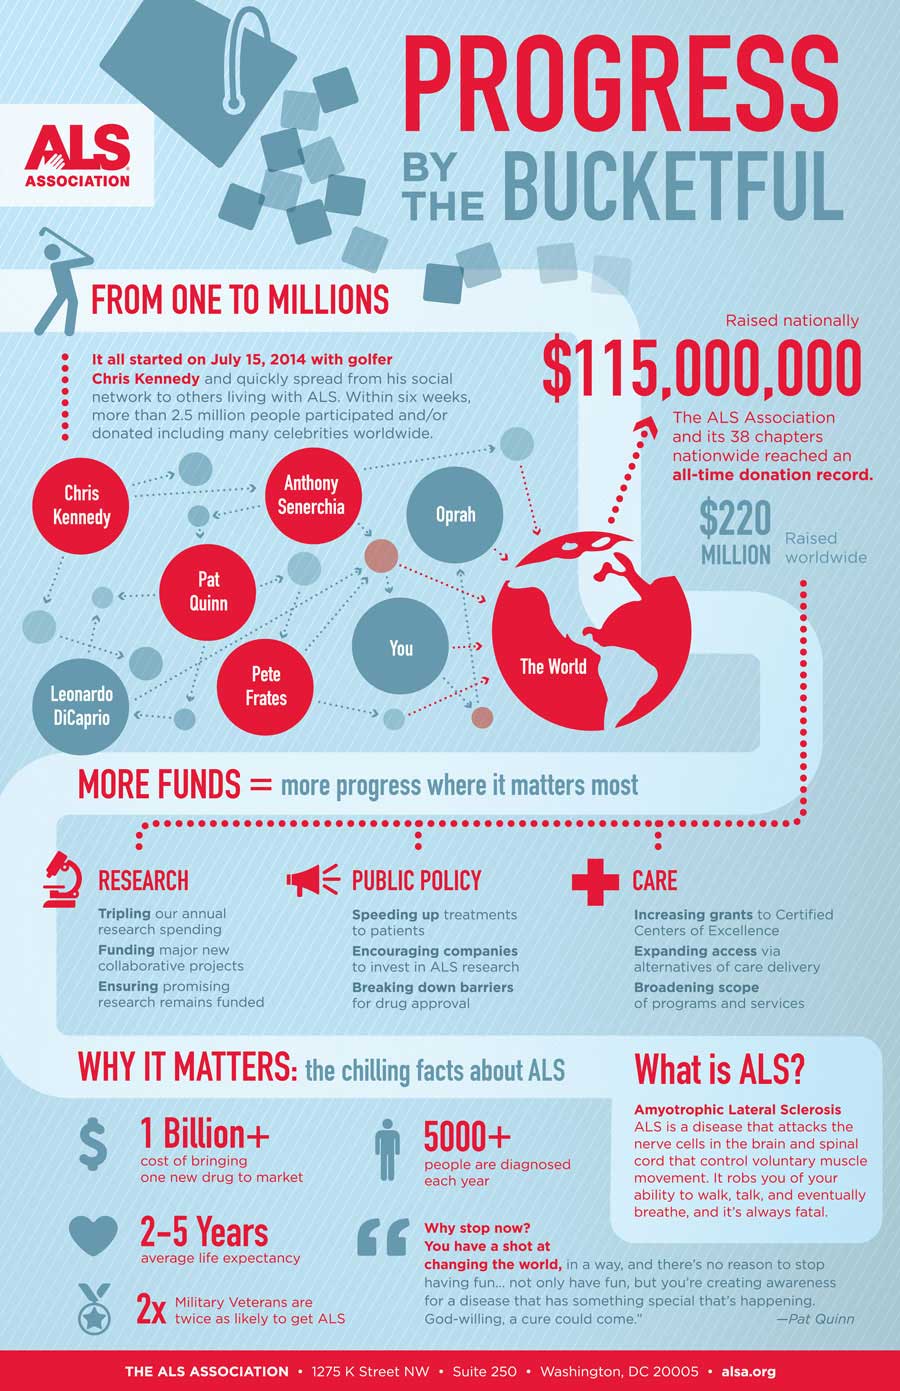
Since you are writing your progress reports this week, today’s #InfographicInspiration is the Amyotrophic Lateral Sclerosis (ALS) Association’s Progress by the Bucketful, which shows the impact of the Ice Bucket Challenge.
This visual presentation of the progress in the work to find a cure to ALS shows the same kinds of information typically included in a progress report: what has happened, what still needs to be done (and why), and how remaining work will happen (in their section, Why Stop Now?). How effective does this progress report seem to you? Does it accomplish its secondary goal of inspiring people to continue contributing to the fight against ALS?
You may also consider what you might include and how you would present information if your progress report were an infographic. Yesterday’s post on visual representation has related ideas that can help you think about how you would create an infographic.
Note: This infographic needs a text-based transcript. See the Optional Accessibility Transcript Activity for more details.