 Someone in the class has asked about how frequently to respond to the Daily Discussion Posts. Her question inspired me to gather some statistics that will show you how students responded to the posts in the past.
General Advice
Think of responding to the discussion posts like participating in a course that meets in the classroom. Chime in when you have something to say, but don’t feel compelled to talk just for the sake of talking.
Counting Your Comments
You can see the number of comments you have made by finding any comment you have made on the blog and looking after your name, as shown in these examples:

Details on the Stats
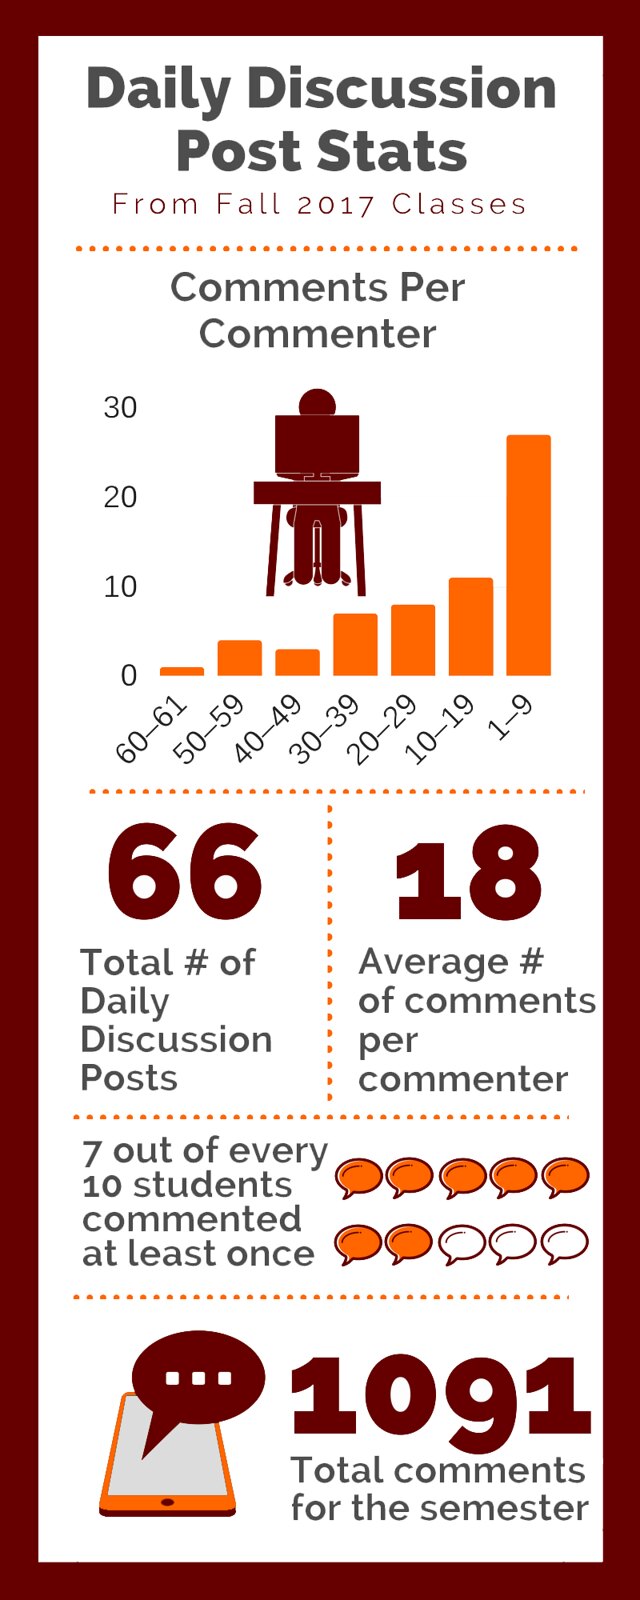
The infographic on the right shows some stats on the comments from the Fall Semester to help you gauge what’s typical. The numbers are for four sections of the course, which works out to 88 students. These numbers are identical to the number of sections and students this term.
Out of the 88 students in the course, 61 of them commented at least once. That works out to about seven students out of every ten.
The highest number of comments by a student was 61. The average number of comments per student was 18. There were a total of 66 Daily Discussion Posts and a total of 1091 comments for the entire semester.
Those who posted more comments tended to do better in the course; but posting more is not a guarantee of an A. You have to meet all the Requirements in the course.
Note: This infographic contents is included in the text of the post, so it does not need a transcript.